1
This article explains debugging
application
crashes in an easy and simpler way for
Windows
Applications. The scope of this article is
limited to user-mode debugging. This article
covers very basic debugging using WinDbg,
procdump.
Note: This is a series of articles divided into
5 parts:
2
To do the practical assignments explained in the
article below, the following is required:
-
Procdump
-
Debugging Tools for Windows
3
While using or working on Windows applications,
we all have seen applications stop working for
unknown reasons. A General Dialog, which we all
have seen, is somewhat similar to this.
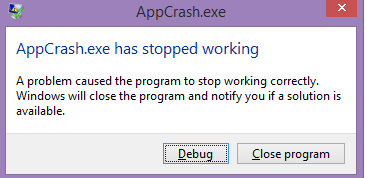
When we see this, we generally select the option
"Close Program" and then try to launch the
application again. If the same repeats and it is
a third party application, then we report the
issue and wait for a solution.
Now, we will move to the other side of the coin,
which is the team that will be analyzing this
issue and give a solution as soon as possible,
because this has stopped production on the
customer site. Let's go into a little bit of
detail and see step-by-step why exactly the
application crashed, why it happened, and how
can we solve this.
Definition
An application crash is an unexpected situation
which stops the normal functioning of the
program. Let's consider the following source
code for example:
 Collapse | Copy
Code
Collapse | Copy
Code
int main()
{
	int *p = NULL;
	cout<<"This is Start";
	*p = 10;
	cout<<"This is End";
	return 0;
}
When we execute this sample, we get the same
dialog as shown above related to the Application
Crash. What is the reason for this application
crash, "*p=10",
"assigning value to an unallocated pointer" or
in other words "assigning value to a NULL
pointer". We can say this since we have the code
and it is small enough to figure out the source
of the problem. Identifying this issue in
millions of lines of code is not easy and fixing
it is far more difficult. So this boils down to
the conclusion that we need to have some
technique by which we could get to the precise
root cause of the issue (or at least around it)
without digging through the entire code.
4
There are many different techniques used to
identify why an app crashes, but some things
remain common across different techniques.
Step 1: Identify the Faulty Module
Identification of faulty module can be done
using the event viewer. Consider our current
example, i.e., AppCrash.exe,
once it has crashed, it would have generated an
event in the event viewer. Go to "Run" type "eventvwr":
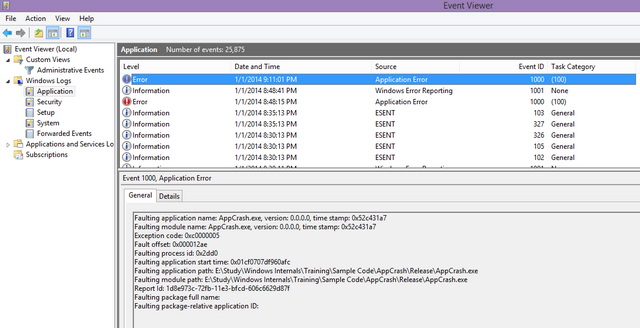
Have a look at the Text written in the General
Tab, there are two interesting points in that:
-
Faulting Application Name:
Indicates the application which is faulty.
In this case, it is AppCrash.exe.
-
Faulting Module Name: Indicates
which module in this application or
executable has misbehaved. In this case
(again), it is AppCrash.exe.
This makes it clear that the issue resides in AppCrash.exe.
If the faulting module had been, for example,AppCrashLib.DLL", then
that would have been the culprit and we would
have had to debug that.
Another important point is Exception Code this
explains what exactly this error means. In the
current case, exception code is 0xC0000005 which
means Access Violation, which means application
is trying to access invalid memory location. To
get the list of all the Exception codes, please
refer to the link below:
This really helps in nailing down the issue.
Step 2: Take the Crash Dump
Crash dump basically contains the current
working state of the program which has
terminated abnormally. Crash dump can also give
us a complete state of the current memory, i.e.,
RAM, which can be used for analyzing the
problem. The simplest way to take the crash dump
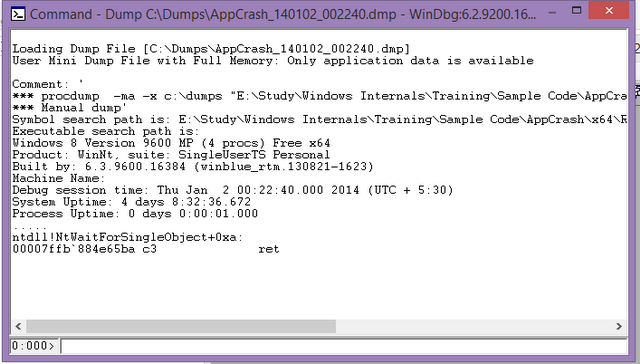
is "procdump." procdump should
be configured before the application crashes, procdump
-ma -x c:\dumps "E:\Study\Windows
Internals\Training\Sample Code\AppCrash\x64\Release\AppCrash.exe".
This is one of the most basic examples of procdump,
more options can be explored. With this option,
it will launch the process and it will take the
full memory dump when the application crashes
and save it to c:\dumps.
Step 3: Analyze the Crash Dump
Now that we have got the dump, we need to
analyze the dump. The best way to analyze the
dump is "Windbg."WinDbg is
the father of all the debugging tools available
(as of the writing of this article) on Windows.
We will not get into the intricacies of Windbg,
this is out of scope of this article. We will be
concentrating only on how we analyze the dumps
with Windbg.
To start analyzing the dump, we need the pdb
files corresponding to the executable version,
which has crashed. pdb is nothing but program
database, it contains all the
debugging
information required for debugging an
application. The only constraint is the pdb and
executable should be of the same timestamp or
else the program database symbols do not match
and hence we cannot analyze the dump.
In the next step, we launch the Windbg and
configure the pdb files as shown below:
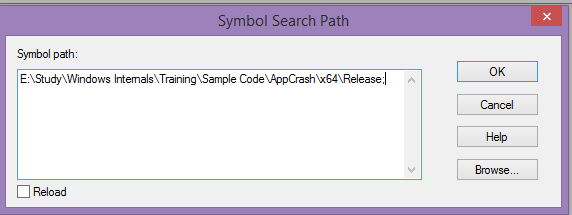
-
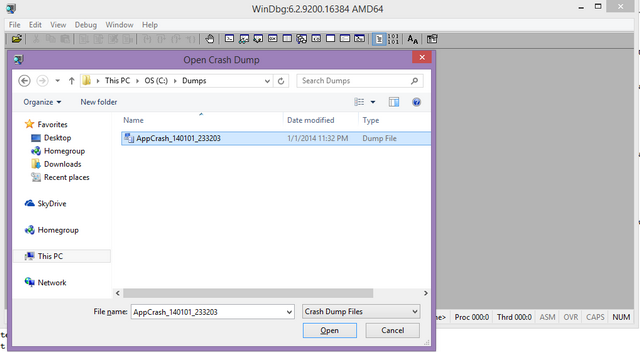
In
Windbg,
Goto File->Open Crash Dump, select the Dump
File and click on open:
-
It will show the below screen after dump
file is being loaded successfully:
-
Just go to the command window and "
!analyze
									-v
" like below:
-
After typing the above command, we do get
the below output:
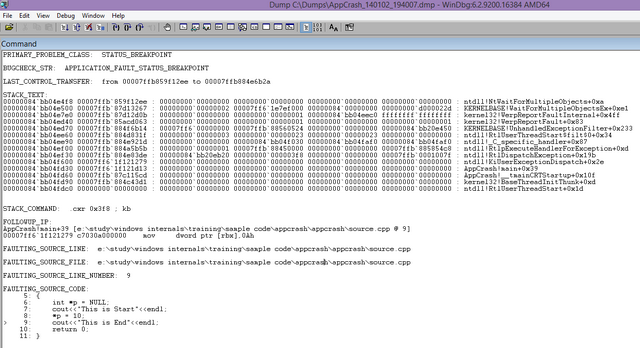
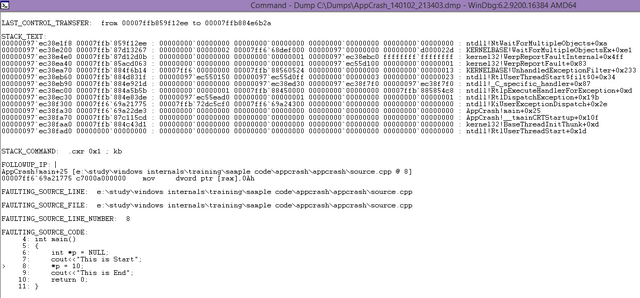
Now, we need to concentrate on different
parameters to identify the issue. If we see the
stack trace, it says the crash happened in Appcrash.exe,
in function main at Offset of 0x39. This does
not give us the exact faulty source code which
may have caused the problem.
Let's check what the below statement says, AppCrash!main+39
[e:\study\windows internals\training\sample
code\appcrash\appcrash\source.cpp @ 9].
This gives us the exact location where the crash
happened and the lines below give us more
details:
Collapse | Copy
Code
FAULTING_SOURCE_CODE:
     5: {
     6: 	int *p = NULL;
     7: 	cout<<"This is Start";
     8: 	*p = 10;
>    9: 	cout<<"This is End";
    10: 	return 0;
    11: }
In the above analysis, the crash actually
happened at line number 8, but windbg points
to line number 9. This is due to optimizations
which are enabled during the compilation. So if
I want to identify the exact line which is
having the issue, it is line number 8. Since the
NULL pointer is being assigned a value, I tried
to write to a location which does not exist.
Step 4: Fix the Issue and Release
Since we know the issue, we can now allocate the
memory for the pointer and then assign the
value. So the new code would be:
Collapse | Copy
Code
int main()
{
	int *p = NULL;
	cout<<"This is Start";
	p = new(std::nothrow)int;
	if(p == NULL)
	{
		return false;
	}
	*p = 10;
	cout<<"This is End";
	return 0;
}
5
We discussed that due to optimizations being
set, we were not able to get the exact point
where the crash is happening. Let's discuss
optimizations some more.
Optimizations mean to what level we are ucancode.neting
the compiler to do optimizations. As we move up
the levels like "Full Optimization" means that
binary size would be lesser and less
debugging
information would be there with the pdb file. As
we move more down the level, for example,
"Disable Optimization," we will have more
debugging information and a larger sized binary
and pdb. Similarly, if we build the binary in
debug mode, we do get more
debugging information
and more the size of binary.
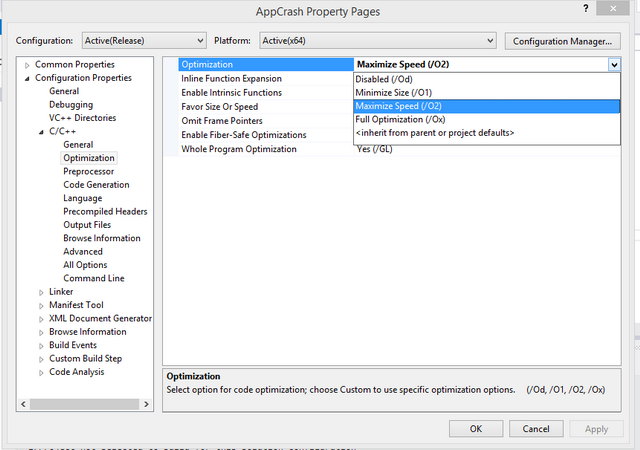
We see that, overall, there are four options
available to be configured. Normally, the option
selected in most projects is "Maximize Speed,"
which is enough for debugging the crashes being
reported by customer. In the above mentioned
example, if we disable the optimizations, then
we do get the following result.
So here, we see that it points exactly to the
position where the problem is i.e *p=10.
This happens since the
debugging information is
sufficient to identify the root cause of the
issue. So as a rule of thumb, when we make the
release, we should maintain the pdb files so
that they can be used to analyze the crash dumps
on customer site.
If the issue is reproduced locally, then it is
recommended that optimization be disabled, then
rebuild the EXE and collect the latest dumps and
analyze them to make life easier.
Debug mode is
not advisable, since there are lot of issues
which will not occur in debug mode.
6
For any unmanaged code which is being built, pdb
files are being created along with EXE files.
These pdb files contain the
debugging
information, which is necessary for
debugging
any issues. In other words, this file is also
known asSymbol
file. Symbol File contains different
symbols which are useful for
debugging. To name
few of them Local Variables,Global Variables,
Function names, Source Line numbers, etc. Each
of this information is known as symbol. There
are 2 Types of Symbols available:
-
Private Symbols: This includes
Functions, Local Variables,Global Variables,
user defined data structures, source line
numbers.
-
Public Symbols: Functions, global
Variables.
Public Symbols contain relatively very less
information as compared to private symbols.
Public symbols contain only that information
which can be viewed across different files. So
this calls out that local variables, will not be
available as part of public symbols. Even most
of the functions in Public symbols will have
decorated names.
Debugging with private symbols will even give
line number of where the problem is (as
explained in the above example), but this will
not be the case with public symbols.
Most of the companies do maintain two symbol
servers, one private for internal use and public
symbols for external distribution.
By default, Visual Studio Build generates
Private Symbols, to make it public add the flag
/pdbstripped under linker section. Follow this
link for
more details.
7
This was a very simple and straightforward way
to debug the issue. Normally, there would be
much more complicated ways compared to this.
Such complications include having multiple
modules and multiple threads, misleading stack
traces which need to be analyzed carefully. We
have just covered a very basic scenario, there
is a lot more to be explored on this.
News:
1 UCanCode Advance E-XD++
CAD Drawing and Printing Solution