1
Quite often developers need to
plot various data.
They expect to use a light control with minimal
dependencies.
2
NTGraph control
is a powerful ActiveX
control which plots multiple data sets.
Unfortunately it depends on MFC libraries.
This new 2D Graph ActiveX
control, named DMGraph, is based on the
NTGraph drawing engine but eliminates the MFC
dependency. For DMGraph, ATL 3.0 was used as the
framework. The only dependencies are some MS
Windows DLLs (the C runtime library msvcrt.dll is
part of the OS starting with Windows 2000). This
means there are no deployment issues - DMGraph
works on Windows 2000 or later.
Another major change compared with old NTGraphCtrl is
the exposed COM interface architecture. Instead
of putting everything together under one
interface, DMGraphCtrl exposes
a hierarchy of interfaces which represents
entities used on drawing.
3
The main interface IDMGraphCtrl contains
collections of items (managed by the IDMGraphCollectioninterface).
This collection interface exposes the usual
methods (such as Add, Delete, Count, Item).
What is specific is the concept of "selected
item". One item in the collection can be the
"selected" one. Sometimes user operations (such
as mouse drag) apply to the "selected" item (if
any). The IDMGraphCollection::Selected property
gets/sets the index of the selected item.
When the user double clicks the graph area, a
modal dialog with property pages is displayed.
This dialog may be invoked programmatically as
well using the ShowProperties method.
Modifying data in these property pages has an
immediate effect on the displayed
graph.
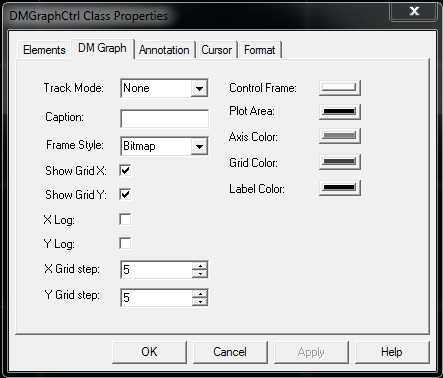
The CDMGraphCtrl class
implements the IDMGraphCtrl interface.
At runtime, some properties can be viewed or
changed using the DM Graph property page:
The CDMGraphCtrl class
keeps the following collections exposed by the IDMGraphCtrl interface:
1. Element collection
The get_Elements property
exposes the elements collection.
Each item is an instance of the CGraphElement class
which exposes the IDMGraphElement interface.
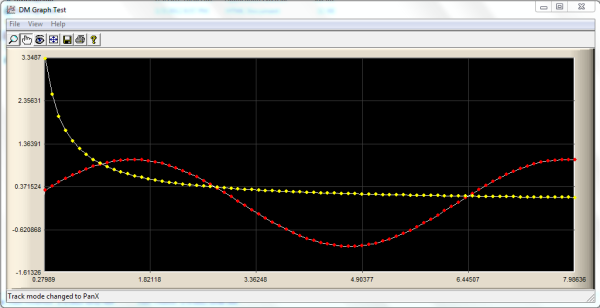
A graph element is
a collection of points which need to be plotted.
The graph element has various properties which
define its drawing style. For example, the Linetype property
defines what kind of line should be used to
connect the points (including "Null" - no lines
at all). Color, width, shape can be set for
points; the entire set of points can be
enabled/disabled for drawing, etc. Each graph
element is identified by a "name". All these are
accessible through COM properties exposed by the IDMGraphElement interface.
When such a property is set, the entire graph is
re-drawn to reflect the changes.
The set of points (data to be plotted) is
supplied by the client using several methods:
-
Plot -
two one-dimensional arrays with same size
(one for X, the other for Y) will set the
entire point collection for a specific graph
element.
-
PlotXY -
appends just one point to the point
collection (both X and Y coordinates are
specified).
-
PlotY -
appends just one point to the point
collection (only Y is specified, the X is
the index of the added point in the points
collection).
Each time the point collection is modified, the
graph is updated to reflect the changes but the
range is not updated. If the new point(s) go(es)
out of range, then the SetRange or AutoRange methods
need to be called.
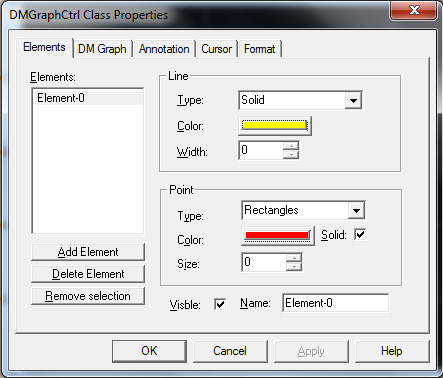
New elements can be added to the collection,
existing ones removed, selected element index
can be changed, and selected element properties
can be viewed/changed from the Elements property
page. Real Time ActiveX
Control
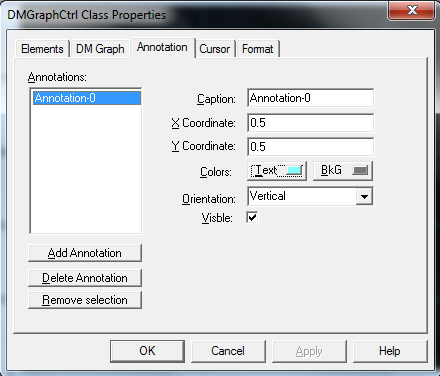
2. Annotation collection
The get_Annotations property
exposes the annotations collection.
One annotation is a piece of text which is
displayed on a specific position on the graph.
This collection keeps instances of the CGraphAnnotation class
which exposes the IDMGraphAnnotation interface.
Using this interface various properties can be
accessed - such as caption (the displayed text),
position, color, text orientation, background
enable/disable. When such a property is set, the
entire graph is re-drawn to reflect the changes.
Plot Graph Control
New annotations can be added to the collection,
existing ones removed, selected annotation index
can be changed, and selected annotation
properties can be viewed/changed from the
Annotations property page.
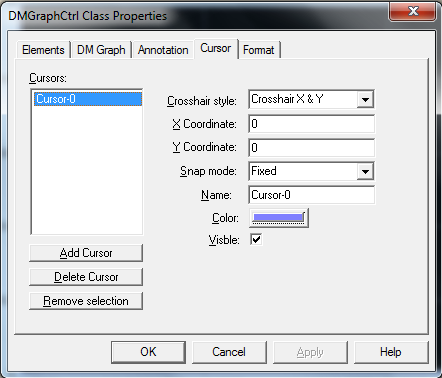
3. Cursor collection
The get_Cursors property
exposes the cursors collection.
A cursor is made of one or two lines which are
parallel with the X or Y axis. The IDMGraphCursor interface
deals with cursor specific properties. If the Style property
(type is the Crosshair enum)
is set to "XY" then the cursor will have two
lines: one parallel with X axis and the other
parallel with Y axis. If the cursor Mode is
set to Snap,
then the selected cursor will snap to the
closest point of the selected graph element
during mouse drag.
New cursors can be added to a collection,
existing ones removed, selected cursor index can
be changed, and selected cursor properties can
be viewed/changed from the Cursors property
page.
4. Axis objects
Two objects are exposed by the get_Axis property:
one for X (horizontal) axis and the other for Y
(vertical) axis. The objects are instances of
the CGraphAxis class
which exposes the IDMGraphAxis interface.
Various properties can be get/set for each axis.
If the put_Time property
is set to VARIANT_TRUE,
then the double values for that axis are
considered to be date/time values. These values
are interpreted like the DATE type
(used in OLE AutomationVARIANT union).
The values are displayed according to the format
string set by the Format property.
For date/time, possible format strings are
documented in the strftime function
in MSDN. Otherwise, for non logarithmic axis,
the usual sprintf format
strings are accepted. Some axis properties are
available in the DM Graph property sheet (see
above) while others are available in the Format
property page (see below).
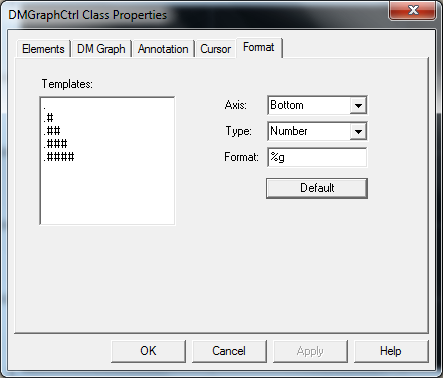
From the Axis combo box, the X (bottom) or Y
(left) axis can be selected. Then the data type
can be set for the selected axis. For each type,
the Templates list box is filled with the
available format templates. When a template item
is selected from the left, the Format string on
the right is updated.
A
1. From a Windows client written in C++ with ATL
 Collapse | Copy
Code
Collapse | Copy
Code
class CMainWnd : public CWindowImpl<CMainWnd>
{
     CAxWindow*                 m_pGraphCtrl;
     CComPtr<IDMGraphCtrl>      m_spDMGraph;
};

LRESULT CMainWnd::OnCreate(UINT uMsg, WPARAM wParam, LPARAM lParam, BOOL& bHandled)
{
     m_pGraphCtrl = new CAxWindow;
     if(m_pGraphCtrl == NULL)
           return -1;
     if(!AtlAxWinInit())
           return -1;
     HRESULT hr;
     CComPtr<IAxWinHostWindow> spHost;
     hr = m_pGraphCtrl->QueryHost(IID_IAxWinHostWindow, (void**)&spHost);
     if(FAILED(hr))
     {
         Message(hr, NULL, L"Cannot query Ax host");
         return -1;
     }
     hr = spHost->CreateControl(L"DMGraph.DMGraphCtrl", m_pGraphCtrl->m_hWnd, NULL);
     if(FAILED(hr))
     {
         Message(hr, NULL, L"Cannot start DM Graph control");
         return -1;
     }

     CComVariant vData;
     hr = m_pGraphCtrl->QueryControl(IID_IDMGraphCtrl, (void**)&m_spDMGraph);
     if(FAILED(hr) || m_spDMGraph == NULL)
     {
         Message(hr, NULL, L"Cannot query DM Graph control");
         return -1;
     }
     return 0;
}

void CMainWnd::SetGraphData(VARIANT* pvarrX, VARIANT* pvarrY, LPCTSTR szName)
{
  ATLASSERT(pvarrX);
  ATLASSERT(pvarrY);
  ATLASSERT(szName);
  CComBSTR bsName(szName);
  CComPtr<IDMGraphCollection> spElements;
  CComPtr<IDMGraphElement> spGraphElement;
  HRESULT hr = m_spDMGraph->get_Elements(&spElements);
  long i, nElementCount = 0;
  BOOL bReplace = FALSE;
  hr = spElements->get_Count(&nElementCount);
  for(i=0; i<nElementCount; i++)
  {
     CComBSTR bsElemName;
     CComPtr<IDispatch> spDispatch;

     hr = spElements->get_Item(i, &spDispatch);

     hr = spDispatch.QueryInterface(&spGraphElement);

     spGraphElement->get_Name(&bsElemName);
     if(_wcsicmp(bsElemName, bsName) == 0)
    {
         OLECHAR szMsgText[256];
        _snwprintf(szMsgText, 256,
              L"There is ALREADY an element named '%s'.\n"
              L"Do you want to replace it ?", bsElemName);
         if(::MessageBoxW(m_hWnd, szMsgText, NULL,
            MB_YESNO|MB_ICONQUESTION) != IDYES)
         {
              return;
         }
         bReplace = TRUE;
         break;
    }
    else
         spGraphElement = NULL;
  }
  if(bReplace == FALSE || spGraphElement == NULL)
  {
     CComPtr<IDispatch>     spDispatch;
     hr = spElements->Add(&spDispatch);
     spGraphElement = NULL;
     hr = spDispatch.QueryInterface(&spGraphElement);

  }
  hr = spGraphElement->put_Name(bsName);
  hr = spGraphElement->put_PointSymbol( Dots );
  hr = spGraphElement->put_PointSize(3);
  hr = spGraphElement->Plot(*pvarrX, *pvarrY);
  if(FAILED(hr))
  {
     Message(hr, spGraphElement, L"Failed to plot items");
     return;
  }
  hr = m_spDMGraph->AutoRange();
}
2. From an HTML page using VBScript
Inside the HTML body, the ActiveX is created
using the object tag.
A button click will execute a script to set the
data to be plotted.
Collapse | Copy
Code
<object ID="DMGraphCtrl"
      CLASSID="CLSID:AAF89A51-7FC0-43B0-9F81-FFEFF6A8DB43"
      width=600 height=400 VIEWASTEXT></object>
<input id=BtnSin value=sin type="button">
<script id=clientEventHandlersVBS language="vbscript">
<!--
Sub BtnSin_onclick
  On Error Resume Next
  Dim dmGraphCtrl
  Set dmGraphCtrl = document.getElementById("DMGraphCtrl")
  Dim idx : idx = dmGraphCtrl.Elements.Selected
  If idx < 0 Then
    MsgBox("Error: please create and select an element first." &_
             vbCrLf & "(Double click to see property pages)")
  Else
    Dim selElement
    Set selElement = dmGraphCtrl.Elements.Item(idx)
    Dim i
    Dim x()
    Dim y()
    ReDim x(100)
    ReDim y(100)
    For i=0 To 100
      x(i) = i/5
      y(i) = Sin( x(i) )
    Next
    selElement.Plot x, y
    dmGraphCtrl.AutoRange()
  End If
  If Err.number <> 0 Then
    MsgBox Err.Description
  End If
End Sub
-->
</script>
3. From a Windows client written in C++ with MFC
Collapse | Copy
Code
#import "..\DMGraph\DMGraph.tlb" no_namespace raw_interfaces_only
class CDmGraphMfcClientDlg : public CDialog
{
... ... ...
IDMGraphCtrlPtr m_spGraph;
};
BOOL CDmGraphMfcClientDlg::OnInitDialog()
{
... ... ...
CWnd* pwndCtrl = GetDlgItem(IDC_DMGRAPHCTRL1);
ASSERT_VALID(pwndCtrl);
IUnknown* pUnkCtrl = pwndCtrl->GetControlUnknown();
HRESULT hr;
m_spGraph = pUnkCtrl;
IDMGraphCollectionPtr colElements;
hr = m_spGraph->get_Elements(&colElements);
IDispatchPtr spDisp;
IDMGraphElementPtr spElem;
hr = colElements->Add(&spDisp);
spElem = spDisp;
hr = spElem->put_Name(_bstr_t("sin"));
hr = spElem->put_PointSymbol( Dots );
hr = spElem->put_PointSize(1);
hr = spElem->put_PointColor( RGB(255, 0, 0) );
COleSafeArray arrx, arry;
arrx.CreateOneDim(VT_R8, 100);
arry.CreateOneDim(VT_R8, 100);
long i;
for(i=0; i<100; i++)
{
double x, y;
x = i/10.;
y = sin(x);
arrx.PutElement(&i, &x);
arry.PutElement(&i, &y);
}
hr = spElem->Plot(COleVariant(arrx), COleVariant(arry));
hr = m_spGraph->AutoRange();
return TRUE; }
Points of interest
-
The "
sprintf"
code which formats the input data needs to
be guarded against exceptions.
-
The
WM_ERASEBKGND needs
to be handled to avoid window flickering
while resizing.
-
The
VARIANT passed
by a VBScript client usually needs
indirection for contained safe array and
conversion for array elements.
Real-Time-Graph-Control.zip
News:
1 UCanCode Advance E-XD++
CAD Drawing and Printing Solution