1
The following is the description for using the
MS Chart control
in
VC++.
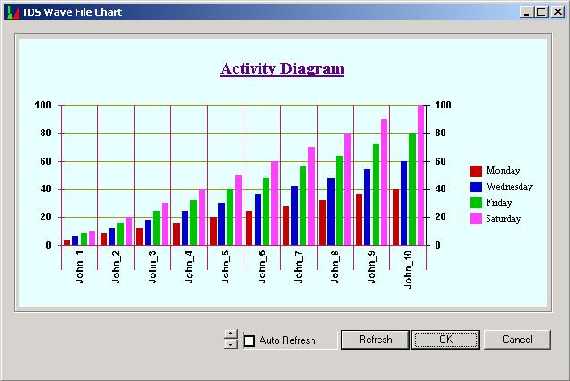
The diagram below will give you an idea of the
chart we are going to make.
First insert the chart control in your project
using Project->Add Reference->Microsoft
Chart Control. Next is populating the
chart control. When
I was working with Visual Basic I had used a
data source to pass data to the chart. But in
VC++ ,I did not get
the data source method in the initial tries. So
I passed the chart data through aCOleSafeArray.
Thanks to J L Colson for illuminating the
details in his article on here.
Here is the code snippet for that.
COleSafeArray saRet;
SAFEARRAYBOUND sab[2];
sab[0].cElements =noOfRows; display in your chart
sab[1].cElements = 5;
sab[0].lLbound = sab[1].lLbound = 1;
m_ChartControl.SetShowLegend(TRUE);
saRet.Create(VT_BSTR, 2, sab);
long index[2] = { 0, 0 }; BSTR bstr;
index[0] = 1;
FILEDETAILS filedetailsstruct; CString cstemp;
for (i = m_filedetails.begin(); i != m_filedetails.end(); i++)
{
filedetailsstruct = (FILEDETAILS *) i;
index[1] = 1;
bstr = filedetailsstruct.login.AllocSysString(); saRet.PutElement(index, bstr);
index[1] = 2;
bstr = filedetailsstruct.n9000.AllocSysString(); ::SysFreeString(bstr);
saRet.PutElement(index, bstr);
index[1] = 3;
bstr = filedetailsstruct.n9002.AllocSysString(); ::SysFreeString(bstr);
saRet.PutElement(index, bstr);
index[1] = 4;
bstr = filedetailsstruct.n9004.AllocSysString(); ::SysFreeString(bstr);
saRet.PutElement(index, bstr);
index[1] = 5;
bstr = filedetailsstruct.nCancel.AllocSysString(); ::SysFreeString(bstr);
saRet.PutElement(index, bstr);
index[0]++;
}
m_ChartControl.SetChartData(saRet.Detach());
Our chart data will look like this:
Hide Copy
Code
2,1  2,2  2,3  2,4  2,5
1,1  1,2  1,3  1,4  1,5
where 1,1 - Row label 1 2,1 - Row Label 2
Okay now to label the columns:
Hide Copy
Code
m_ChartControl.SetColumnLabelCount(4);
m_ChartControl.SetColumn(1);
m_ChartControl.SetColumnLabel("Monday");
m_ChartControl.SetColumn(2);
m_ChartControl.SetColumnLabel("Wednesday");
m_ChartControl.SetColumn(3);
m_ChartControl.SetColumnLabel("Friday");
m_ChartControl.SetColumn(4);
m_ChartControl.SetColumnLabel("Saturday");
Thats it folks.
2
MFC42.DLL, MSVCRT.DLL, KERNEL32.DLL, USER32.DLL, ADVAPI32.DLL, OLEAUT32.DLL
Developed On Windows 2000 Server using
VC++ ver 6
MS Chart Control
News:
1 UCanCode Advance E-XD++
CAD Drawing and Printing Solution
Source Code Solution for C/C++, .NET V2025 is released!
2
UCanCode Advance E-XD++
HMI & SCADA Source Code Solution for C/C++, .NET V2025 is released!
3
UCanCode
Advance E-XD++ GIS SVG Drawing and Printing Solution
Source Code Solution for C/C++, .NET V2025 is released!