A working code example on how to implement
basic functionalities of Machine learning
using C++
Data preprocessing is the process
of converting raw Data into computer
understandable formats, it’s the first step in
any machine learning operation.
Data collection is
usually loosely controlled and may result in
out-of-range values. Data
preparation and filtering steps can take a
considerable amount of processing time.
Data preprocessing
includes:
Reading Data
from files.
Data cleaning.
Instance selection.
Data
standardization.
Data
transformation.
Feature extraction and selection.
The product of Data preprocessing is the final training
set. In this article, I will address
some of the Data
preprocessing steps while using
C++, also Data
Visualization using the Matplotlib-Cpp library.
This articleis
part of a series that address the implementation
of Machine learning algorithms in
C++, throughout
this series, We will be using the Iris Data set
available here.
Note that there are already libraries that can
do this job easily, but the purpose of this
series is to learn how to develop these
algorithms from scratch. if you are interested
in learning more about the ML libraries for C++
you can read this article:
In this article, I will use the iris
dataset as an example of the Data that we
can perform each operation on it, also note that
I will be using C++11 in this tutorial.
Reading Data from Files:
After downloading the iris.Data file from here.
let’s read the Data from a file with simple read
file instructions and parse each type of Data in
a separate vector.
std::cout<<
"file opened successfully"<<std::endl;
while (std::getline(myfile,
line)) {
std::replace(line.begin(),
line.end(),
'-',
'_');
std::replace(line.begin(),
line.end(),
',',
'
');
std::istringstream
iss(line);
count++;
iss >> sepal_len_f>>sepal_wid_f >>
petal_len_f >>petal_wid_f >> temp_string;
temp_sepal_len.push_back(sepal_len_f);
temp_sepal_wid.push_back(sepal_wid_f);
temp_petal_len.push_back(petal_len_f);
temp_petal_wid.push_back(petal_wid_f);
if(temp_string.compare("Iris_setosa")
==
0)
{
iris_class_f = Iris_setosa;
}
else
if (temp_string.compare("Iris_versicolor")
==
0)
{
iris_class_f = Iris_versicolor;
}
else
if (temp_string.compare("Iris_virginica")
==
0)
{
iris_class_f = Iris_virginica;
}else
{
iris_class_f = Iris_unkown;
}
temp_iris_class.push_back(iris_class_f);
}
Iris_Dataset.push_back(temp_sepal_len);
Iris_Dataset.push_back(temp_sepal_wid);
Iris_Dataset.push_back(temp_petal_len);
Iris_Dataset.push_back(temp_petal_wid);
Iris_Dataset.push_back(temp_iris_class);
}
else
{
std::cout <<
"Unable to open file";
}
return Iris_Dataset;
}
In this code, we used the ifstream to create a
simple input stream from a file.
std::ifstream myfile("iris.data");
We used also multiple vectors to read each type
of information in the Data set then append all
the Data into a single two-dimensional vector.
std::vector<std::vector<float>>
Iris_Dataset;
std::vector<float>
temp_sepal_len;
std::vector<float>
temp_sepal_wid;
std::vector<float>
temp_petal_len;
std::vector<float>
temp_petal_wid;
std::vector<float>
temp_iris_class;
...
temp_sepal_len.push_back(sepal_len_f);
temp_sepal_wid.push_back(sepal_wid_f);
temp_petal_len.push_back(petal_len_f);
temp_petal_wid.push_back(petal_wid_f);
...
Iris_Dataset.push_back(temp_sepal_len);
Iris_Dataset.push_back(temp_sepal_wid);
Iris_Dataset.push_back(temp_petal_len);
Iris_Dataset.push_back(temp_petal_wid);
In the iris Data set, All the Data was from the
same Data type except the iris class Data which
was string type so I have to convert this into
an enum type and deal with it as a float to
match the rest of the Data in the Iris_Data set
vector.
However, you can always use other ways to load
your Data with different types, like you can
create a structure and load your Data on it or
create a class for the iris Data set and load
the Data on that class.
struct
Iris {
float sepal_length;
float sepal_width;
float petal_length;
float petal_width;
std::string ir_class;
};
for now, I decided to proceed with this simple
way of dealing with Data with the same datatype.
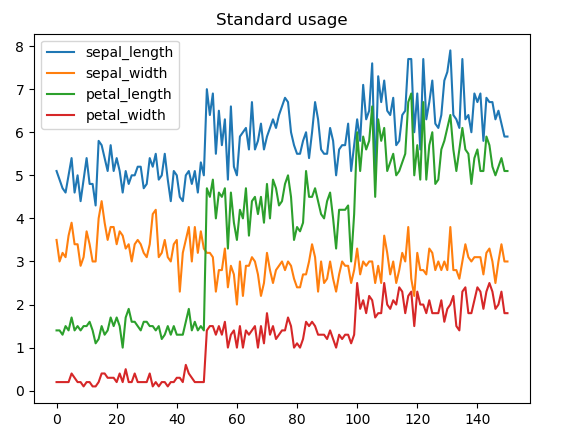
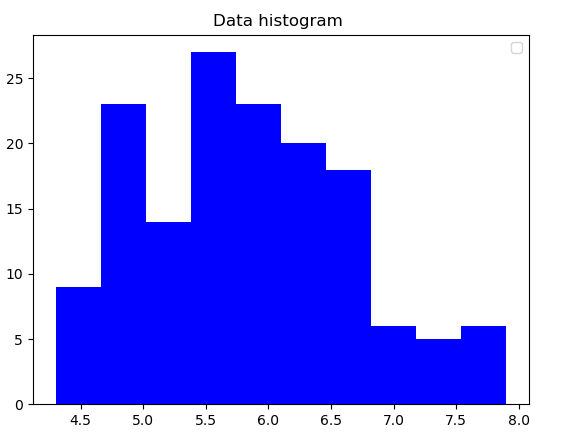
Data Visualization:
Images speak louder than words, Representing the
Data visually can be important for understanding
the data, collecting information about the data,
and identifying the outliers.
While this seems less important in developing
the Machine learning algorithms using C++, as
mostly you will be working with Data with other
languages like python for testing and
implementing the algorithm and then the
algorithm can be converted to C++, I believe
this can be important to visualize the Data
during the implementation for debugging purposes
for example.
In this article, I will be using the Matplotlib-CPP,
which is a simple wrapper for the python APIs of
Matplotlib. Please review the documentation to
know more about the library.
Using Matplotlib-CPP is simple, you need just to
include the header file “matplotlibcpp.h” and
link it with python libraries. here is the
minimal example from their GitHub repository:
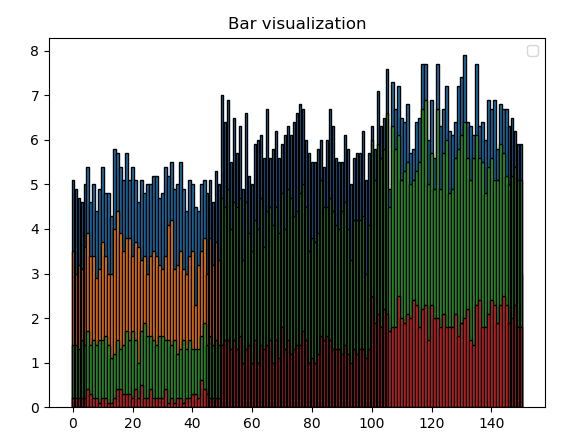
Another way to represent the Data using the bar
API:
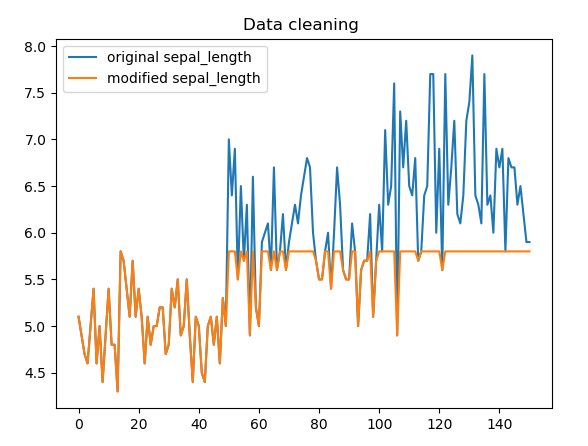
Data Cleaning:
The process of detecting and correcting (or
removing) corrupt or inaccurate Data from a Data
set, for example, you may have some missing,
inconsistent values or outliers introduced
during the Data collection phase.
In the previous function, you may notice that I
used the replace std::replace function
to replace some values. This step can be used to
remove or replace any value before even reading
the Data into vectors. For example here, I
suspected that “,” or “-” may confuse loading
the values from the file so I decided to use a
unified way of reading by replacing them with
other values.
Here is an example of removing values greater
than 5.8 in the Sepal Length
This can be done by adding one line of code
std::replace_if(dataset[0].begin(),
dataset[0].end(), [](float
&value) {
return value >=
5.8;},
5.8);
Data Standardization:
Data standardization is an important step in
machine learning models to enhance the model
accuracy. To understand more about the
importance of Data standardization, you can read
the following article:
Standardizing a Data set involves re-scaling the
distribution of values so that the mean of
observed values is 0 and the standard deviation
is 1. This will require subtracting the mean and
dividing by the standard deviation.
First, we implement an API for calculating the
Mean:
template <typename
T>
T
Mean (std::vector<T> Data)
{
T mean =
std::accumulate(std::begin(Data),
std::end(Data),
0.0) / Data.size();
return mean;
}
This API will take a vector of any standard type and calculate the mean value. A
similar one can be used used to calculate the standard deviation.
template <typename
M>
double
StDev (std::vector<M> &Data)
{
M mean =
std::accumulate(std::begin(Data),
std::end(Data),
0.0) / Data.size();
subtracting the mean and dividing by the
standard deviation on each vector value using
lambda expressions
In this article, we gave an example of the
implementation of some of the Data preprocessing
steps, we introduced reading Data from files,
Data Visualization using Matplotlib cpp, Data
cleaning, and performing some operations like
mean and standard deviation on the Data as part
of the Data normalization.
This article is part of a series that address
the implementation of Machine learning
algorithms in C++, throughout this series, We
will be using the Iris Data set available here.
Copyright ?1998-2025 UCanCode.Net Software , all rights reserved.
Other product and company names herein may be the trademarks of their respective owners.