This Artical is on
OpenGL Library with
3D
support, it is based on
Graph ActiveX
Control, the source codes of this
activex control
can be downloaded with the following link:
Introduction
This is an
ActiveX control based on the
OpenGL
library, which allows you to plot
three-dimensional data. The control is
entirely written on ATL/STL, and does not
link to MFC
libraries.
The control
can perform the following functions:
- Axis customization, including
customizable font, colors, and titles.
- Plot a large number of points and
updating one or more plots on the graph
with new data, replacing the old plot
with the new plot.
- Plot the multiple elements with
individual properties such as line and
point color, line width, and point size.
- Lighting
- Plot styles: {0 (Lines); 1 (Points);
2 (LinePoint); 3 (Surface)}
- By setting the
Projection
property you should be able to change
the viewing to: (0) Perspective (in
which objects that are closer appear
larger), and (1) Orthographic (in which
the sizes and angles between objects are
maintained no matter what their distance
from the viewer).
- By setting the
TrackMode
property you should be able to do: (1)
Zooming, (2) Rotation, and (3) Panning
at runtime.
About the Code
To use this control, embed it in an
application that supports the use of
ActiveX controls.
Microsoft Visual Basic applications, all MS
Office applications, VBScript and JavaScript
in the HTA or Internet Explorer
applications, and applications created with
the Microsoft Developer Studio�s AppWizard
can support the use of
ActiveX controls.
Before you start, the control must be
register as a COM component using
Regsvr32.exe. Regsvr32 takes
one argument the DLL or control to register
and any of several command-line switches,
the most notable of which is /u to uninstall
a control. By default that is, when run with
only a dll or ocx Regsvr32.exe
registers the control.
Note: you must do
this on every computer that you are going to
use the control!
For more information on how to register
and how to include the control in a VC
Project, refer to my article 2D
Graph ActiveX
Control.
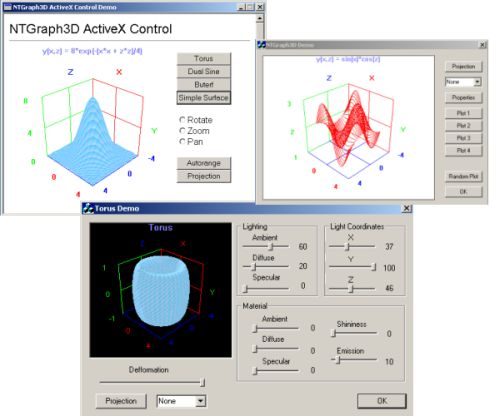
Bellow are two listings that demonstrates
how to use the control to
draw a
Torus:
C++
 Collapse
 |
Copy Code
void CDemoDlg::OnButton1()
{
m_Graph3D.SetCaption ("Torus");
m_Graph3D.ClearGraph(); m_Graph3D.AddElement();
m_Graph3D.SetElementLineColor(0, RGB(255,0,0));
m_Graph3D.SetElementType(0, 3);
double x,y,z,ti,tj;
for (int i = 0; i < 41; i++)
{
ti = (i - 20.0)/20.0 * 3.15;
for (int j = 0; j < 41 ; j++)
{
tj = (j - 20.0)/20.0 * 3.15;
x = (cos(tj) + 3.0) * cos(ti);
y = sin(tj);
z = (cos(tj) + 3.0) * sin(ti);
m_Graph3D.PlotXYZ(x,y,z,0);
}
}
m_Graph3D.AutoRange();
}
Visual Basic
Collapse |
Copy Code
Sub Torus
With Graph3D
.ClearGraph
.AddElement
.Caption = "Torus"
.ElementType(0) = 3
For i = 0 To 41
ti = (i - 20.0)/20.0 * 3.15
For j = 0 To 41
tj = (j - 20.0)/20.0 * 3.15
x = (cos(tj) + 3.0) * cos(ti)
y = sin(tj)
z = (cos(tj) + 3.0) * sin(ti)
.PlotXYZ x,y,z,0
Next
Next
.Autorange
End With
End Sub
List of Control
Properties:
Graph
-
short
										Appearance
-
long
										BorderStyle
-
VARIANT_BOOL
										BorderVisible
-
BSTR Caption
-
IFontDisp*
										Font
-
OLE_COLOR
										BackColor
-
OLE_COLOR
										CaptionColor
-
short
										TrackMode
-
short
										Projection
-
BSTR XLabel
-
BSTR YLabel
-
BSTR ZLabel
-
short
										XGridNumber
-
short
										YGridNumber
-
short
										ZGridNumber
-
OLE_COLOR
										XGridColor
-
OLE_COLOR
										YGridColor
-
OLE_COLOR
										ZGridColor
Elements
-
OLE_COLOR
										ElementLineColor(long
										ElementID, OLE_COLOR newVal)
-
OLE_COLOR
										ElementPointColor(long
										ElementID, OLE_COLOR newVal)
-
float
										ElementLineWidth(long
										ElementID,
										float newVal)
-
float
										ElementPointSize(long
										ElementID,
										float newVal)
-
short
										ElementType(long
										ElementID)
-
BOOL
										ElementShow(long
										ElementID)
-
BOOL
										ElementSurfaceFill(long
										ElementID)
-
BOOL
										ElementSurfaceFlat(long
										ElementID)
-
BOOL
										ElementLight(long
										ElementID
-
short
										ElementLightingAmbient(long
										ElementID)
-
short
										ElementLightingDiffuse(long
										ElementID)
-
short
										ElementLightingSpecular(long
										ElementID)
-
short
										ElementMaterialAmbient(long
										ElementID)
-
short
										ElementMaterialDiffuse(long
										ElementID)
-
short
										ElementMaterialSpecular(long
										ElementID)
-
short
										ElementMaterialShinines(long
										ElementID)
-
short
										ElementMaterialShinines(long
										ElementID)
-
short
										ElementMaterialEmission(long
										ElementID)
List of Control
Methods:
Graph
-
void
										SetRange(double
										xmin, double
										xmax, double
										ymin, double
										ymax, double
										zmin, double
										zmax)
-
void
										AutoRange()
-
void
										ShowPropertyPages()
Elements
-
void
										AddElement()
-
void
										DeleteElement(long
										ElementID)
-
void
										ClearGraph()
-
void
										PlotXYZ(double
										x, double
										y, double
										z, long
										ElementID)
-
void
										SetLightCoordinates(long
										ElementID,
										float x,
										float
										y, float
										z)